

Statistics
The Statistics page measures what really happens on your server: messages, voice, posted content, members, joins and leaves, moderation, staff, community site. Every chart compares with the previous period, and alerts or reports keep you posted without opening the dashboard.
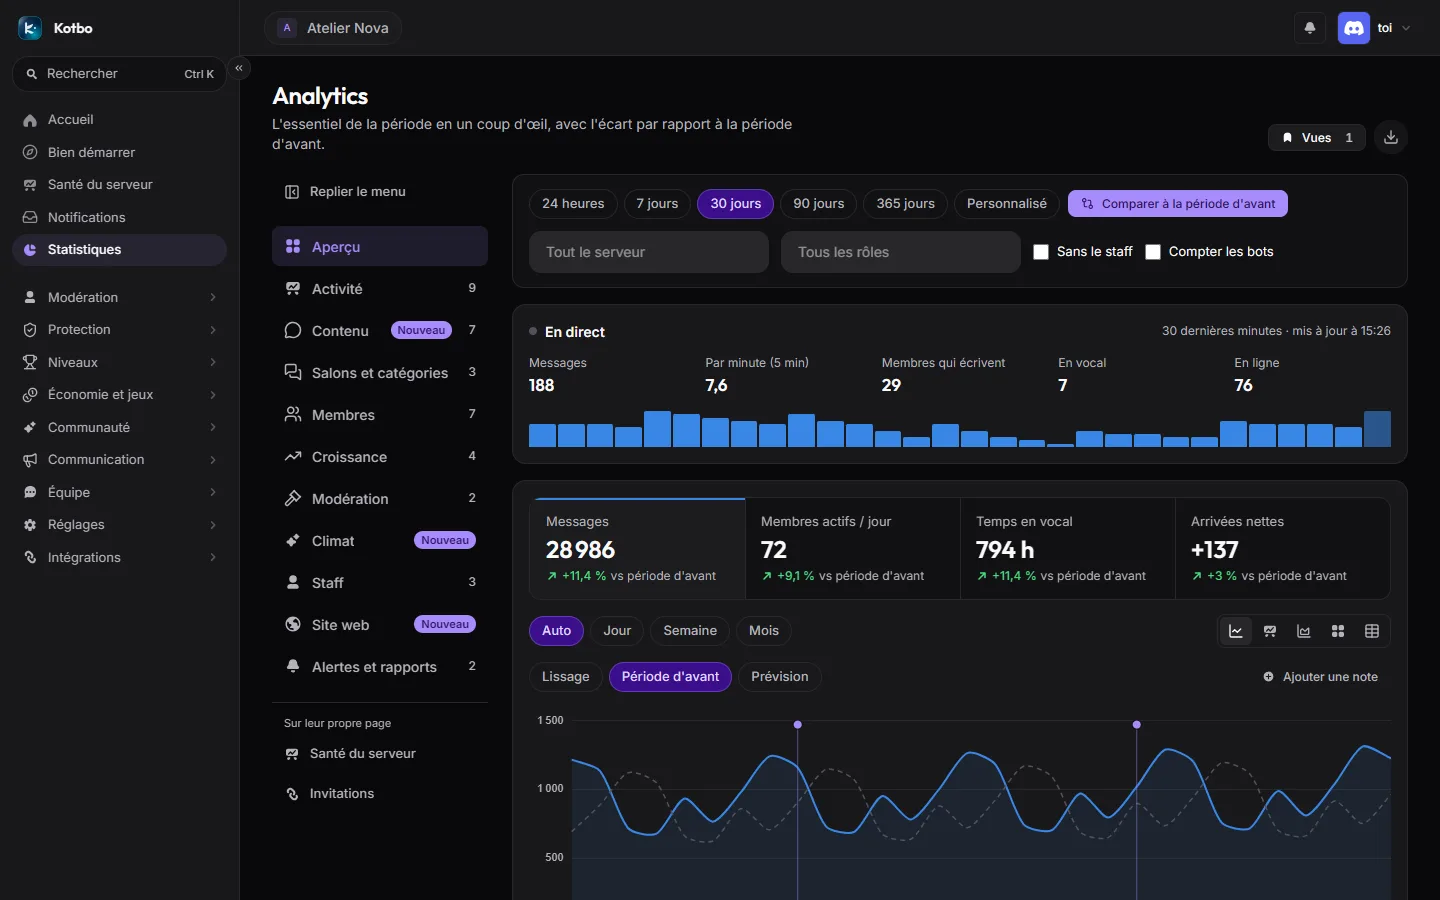
Finding your way
Section titled “Finding your way”On the left, a bar lists the sections; each has its sub-tabs at the top of the page. The bar collapses into icons (it does so on its own on a narrow screen) and expands with a click. Sections marked New are recent. At the bottom of the bar, On their own page leads to Server health and Invites.
Each sub-tab has its own address: a shared link opens exactly the same view.
The filter bar
Section titled “The filter bar”- Period: 24 hours, 7 days, 30 days, 90 days, 365 days or Custom (From / To dates, then Apply).
- Compare with previous period: overlays the previous period as a dotted line and shows the changes.
- A channel or category (Whole server by default) and a role (All roles).
- Without staff takes the team out of the figures; Count bots only changes the member count, since bots never post in activity stats.
- Clear filters goes back to the original view.
Some sub-tabs only follow the period, or have their own time window (live, for instance): a banner says so.
Saved views
Section titled “Saved views”The Views menu saves the current tab, period and filters under a name, to come back in one click. Share with the team makes the view visible to everyone with access to statistics.
Reading a chart
Section titled “Reading a chart”The main activity chart is driven by its figure cards: clicking a metric (messages, voice, active members…) shows it in the chart, with its Total, Average, Peak and Minimum.
- Time step: Auto, Hour, Day, Week or Month. Hourly steps only exist for the whole server, over 14 days at most.
- Display: Line, Bars, Stacked by channel, Stacked by category or Table.
- Smoothing: Moving average, Previous period and Forecast (which needs 28 days of history, at daily step, over a period ending today).
- Unusual days are flagged on the chart.
Add a note puts a dated marker on the charts (“tournament”, “ad on another server”…). Clicking a point on the chart picks its date. Notes are visible to everyone on the team with access to statistics, with their author.
Rankings (members, channels…) switch between Table and Bars, with the change from the previous period. See all opens the full ranking, with search and export.
Clicking a member, a channel, a category or an invite opens its card in a window, with its charts, key figures and the same comparison with the previous period.
The sections
Section titled “The sections”| Section | Sub-tabs | What you find there |
|---|---|---|
| Overview | Overview | The essentials of the period, compared with the previous period, plus a live summary. |
| Activity | Messages, Voice, Live, Compare, Activity hours, Server health, Week over week, Commands, Daily Algo | Messages and voice, busiest channels, peak hours, commands used. |
| Content | Overview, Emojis, Stickers, GIFs, Sites, Formatting, Words | What members post: message types, emojis (Unicode, from the server or elsewhere, and their origin server), stickers, GIFs and where they come from, linked sites, formatting, rising words. |
| Channels and categories | Categories and channels, Response time, Channel health | Each category with its channels, text and voice together; how long it takes to get an answer; each channel’s health. |
| Members | Members, Engagement, Lifecycle, Concentration, Network, Social, Silent members | Who keeps the server alive: daily, weekly and monthly active members and their stickiness, lifecycle segments, how much of the activity a few members carry, the network of exchanges, members who went quiet. |
| Growth | Joins and leaves, Onboarding funnel, Cohorts, Departures | Joins and leaves, where joins come from, steps between joining and the first message, cohort retention, departures by seniority and churn risk. |
| Moderation | Moderation, Moderation trends | Sanctions, ongoing sanctions, recurring reasons, most sanctioned members, active moderators. |
| Tone | Tone | Toxicity and emotions in conversations, measured by AegisAI. |
| Staff | Staff directory, Staff performance, Tickets and responsiveness | The team, each member’s performance, and ticket workload and responsiveness. |
| Website | Site traffic | Traffic to the community site, measured without cookies. |
| Alerts and reports | Alerts, Scheduled reports | See below. |
Live follows the server in real time, over the last 30 minutes: Messages and pace Per minute (5 min), Members writing, In voice, Online, Joins, plus Busy channels and Occupied voice channels.
Compare
Section titled “Compare”Compare segments puts two or three roles or channels side by side over the chosen period, or the chosen period against another one (Two periods). Metrics: Messages, Active members or Voice time, day by day and as Key figures.
Alerts and reports
Section titled “Alerts and reports”Threshold alerts
Section titled “Threshold alerts”New alert tells you when a metric moves, for example “if messages drop 30% over a day”:
- a Name, the Metric, the Window, the Condition and the Threshold; the In plain words sentence sums up the rule;
- a Watched channel (optional: whole server otherwise);
- the Cooldown after trigger (hours), so you don’t get the same alert over and over;
- recipients: a Delivery channel and/or Staff members By direct message (10 at most; a member with closed DMs receives nothing).
Alerts are checked every 5 minutes. Recent triggers compares the measured value with the usual value. A drop in the Server health score can be watched with an alert too.
Scheduled reports
Section titled “Scheduled reports”New report sends a Weekly or Monthly summary - the past week or month, compared with the previous period - on the chosen Day and time, in the server’s time zone. Pick its Sections and recipients, as for an alert. Send a test delivers it right away.
Exporting
Section titled “Exporting”The Export button offers three formats:
- Export CSV
- Export XLSX
- Export image: generates an image of every chart visible on screen
Stopping collection
Section titled “Stopping collection”Turning off the Analytics module from the module catalogue stops all recording: messages, voice minutes, reactions, threads, joins and leaves, per-member statistics, message content, exchanges between members, word frequency and usage rankings.
Other modules (moderation, tickets, levels…) keep working normally. Only the bot’s technical measurements (run times and errors, with no identity) are kept.